import pandas as pd
import numpy as np

df = pd.read_csv("wdi.csv")Assignment 05
Conducting Exploratory Data Analysis
In this report we will be focusing on the following 3 variables in order to better understand the global landscape in 2022:
primary_school_enrolment_rate: measures the percentage of children of official primary school age who are enrolled in primary education.
life_expectancy: is the average number of years someone is expected to live
unemployment_rate: measures the percentage of the total labor force that is without work but are able to work/ looking for work.
Primary School Enrollment EDA
prim_enrol = df['primary_school_enrolment_rate']

prim_enrol_clean = prim_enrol.dropna()

print("Mean:", prim_enrol_clean.mean())
print("Median:", prim_enrol_clean.median())
print("Standard Deviation:", prim_enrol_clean.std())
Mean: 100.87404840034348
Median: 100.0222473144529
Standard Deviation: 12.037531967222588The mean for primary school enrollment for 2022 was approximately 100.87% enrollment rate with a standard deviation of about 11.98%. The median is around 100% enrollment rate.
Life Expectancy EDA
life_exp = df['life_expectancy']

life_exp_clean = life_exp.dropna()

print("Mean:", life_exp_clean.mean())
print("Median:", life_exp_clean.median())
print("Standard Deviation:", life_exp_clean.std())
Mean: 72.4165186136072
Median: 73.5146341463415
Standard Deviation: 7.713322276991691The mean for life expectancy for 2022 was approximately 72.42 years old with a standard deviation of about 7.71 years. The median is around 73.51 years old.
Unemployment Rate EDA
unempl_rate = df['unemployment_rate']

unempl_rate_clean = unempl_rate.dropna()

print("Mean:", unempl_rate_clean.mean())
print("Median:", unempl_rate_clean.median())
print("Standard Deviation:", unempl_rate_clean.std())
Mean: 7.268661290322581
Median: 5.5375
Standard Deviation: 5.827726289581319The mean for unemployment rate for 2022 was approximately 7.27% with a standard deviation of about 5.83%. The median is around 5.54% unemployment rate.
Scatterplot (life expectancy vs unemployment rate)
import matplotlib.pyplot as plt

d = df[['life_expectancy', 'unemployment_rate']].dropna()

plt.figure()
plt.scatter(d['unemployment_rate'], d['life_expectancy'])
plt.title("Life Expectancy vs Unemployment Rate (2022)")
plt.xlabel("Unemployment rate (%)")
plt.ylabel("Life expectancy (years)")
plt.show()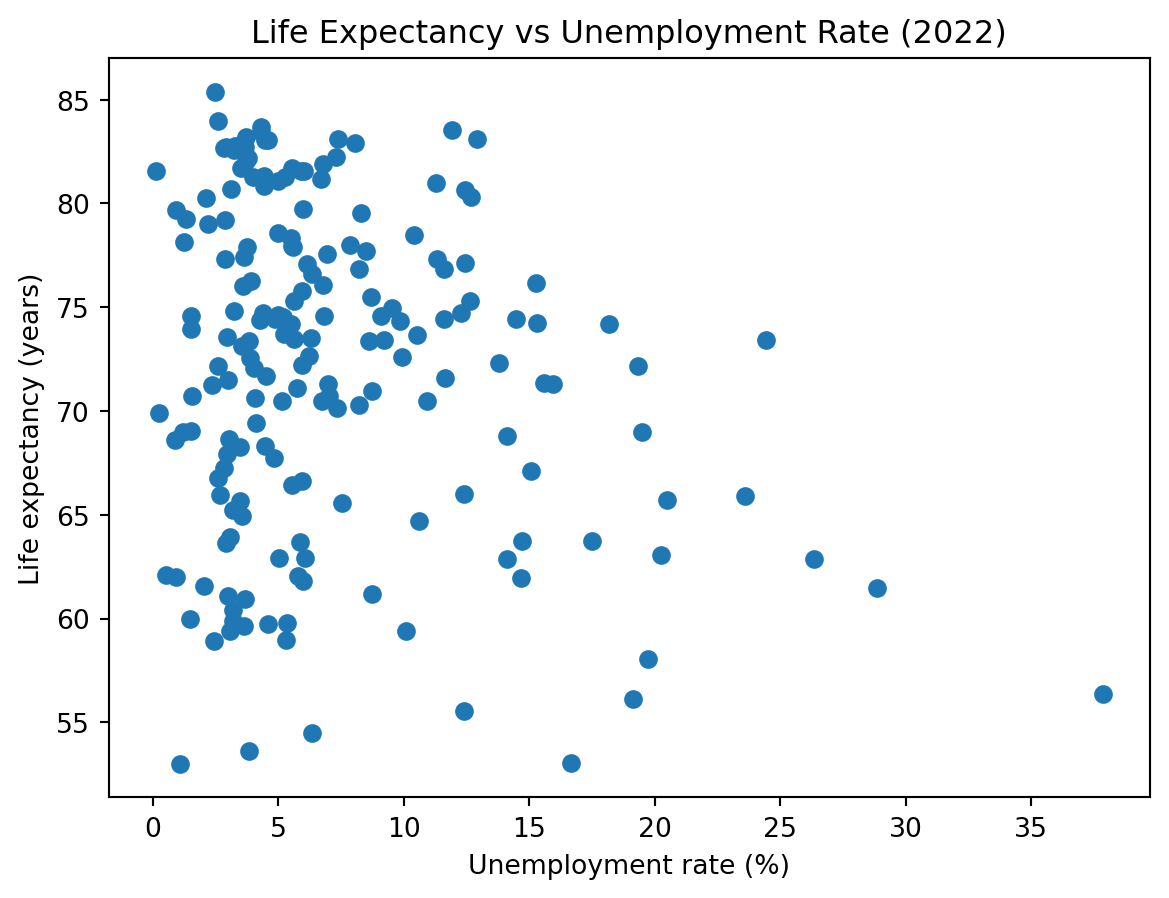
Histogram (primary school enrollment rate)
d = df['primary_school_enrolment_rate'].dropna()

plt.figure()
plt.hist(d, bins=30)
plt.title("Primary School Enrollment Rate (2022)")
plt.xlabel("Primary school enrolment rate (%)")
plt.ylabel("Number of Countries per Rate")
plt.show()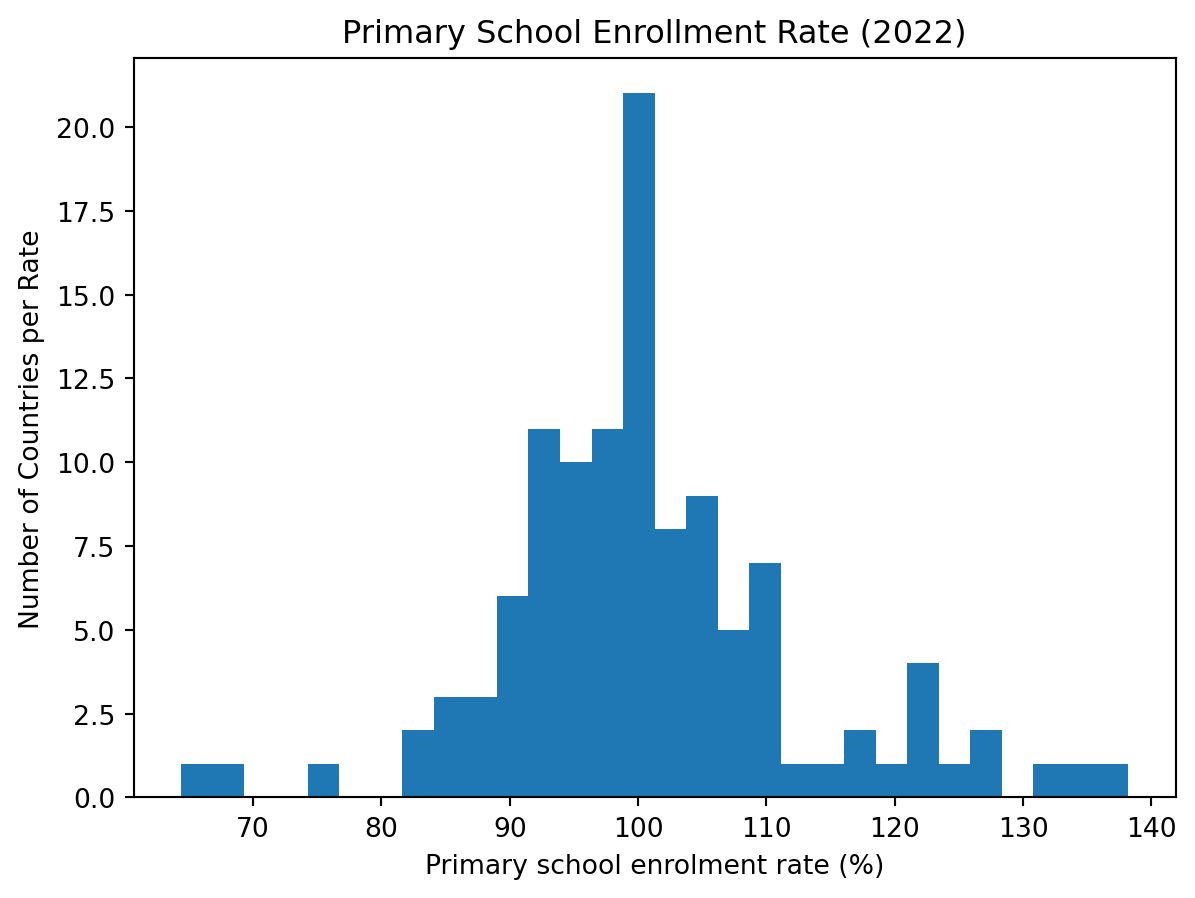
Key Statistics
# Select variables and remove missing values
d = df[['primary_school_enrolment_rate',
        'life_expectancy',
        'unemployment_rate']]

summary = pd.DataFrame({
    "Mean": d.mean(),
    "Median": d.median(),
    "Standard Deviation": d.std(),
    "Minimum": d.min(),
    "Maximum": d.max()
})

summary| Mean | Median | Standard Deviation | Minimum | Maximum | |
|---|---|---|---|---|---|
| primary_school_enrolment_rate | 100.874048 | 100.022247 | 12.037532 | 64.395401 | 138.192001 |
| life_expectancy | 72.416519 | 73.514634 | 7.713322 | 52.997000 | 85.377000 |
| unemployment_rate | 7.268661 | 5.537500 | 5.827726 | 0.130000 | 37.852000 |
Conclusion
As shown in Figure 1, there appears to be a negative association between unemployment rates and life expectancy in 2022. Countries with lower unemployment rates generally tend to exhibit higher life expectancy, suggesting that stronger labor markets may be associated with better overall life quality and life expectancy.
Studies have shown that unemployment rates and other related socioeconomic factors are associated with mortality and life expectancy. For example, research shows that long-term unemployment correlates with reduced life expectancy and greater disability over time (Laditka and Laditka 2016), and the protective effect of employment on longevity varies by race, gender, and education (Assari 2017).
Figure 2 illustrates that the primary school enrollment rate distribution is approximately unimodal and centered around 100%. The distribution appears relatively concentrated near full enrollment, though several countries exhibit enrollment rates exceeding 100%. This is consistent with the use of a gross enrollment rate measure, which can exceed 100% due to the inclusion of over-aged or under-aged students enrolled in primary education.
The key summary statistics are reported in Table 1, which highlights variation across indicators.
References
Assari, Shervin. 2017. “Life Expectancy Gain Due to Employment Status Depends on Race, Gender, and Education.” International Journal of Environmental Research and Public Health. https://www.ncbi.nlm.nih.gov/pmc/articles/PMC6392452/.
Laditka, James N., and Sarah B. Laditka. 2016. “Unemployment, Disability and Life Expectancy in the United States: A Life Course Study.” Disability and Health Journal 9 (1): 46–53. https://www.sciencedirect.com/science/article/pii/S1936657415001077.
World Bank. 2022. “World Development Indicators.” World Bank Open Data. https://databank.worldbank.org/source/world-development-indicators.