Primary school enrollment • Life expectancy • Unemployment rate
Conducting Exploratory Data Analysis
In this report we will be focusing on the following 3 variables in order to better understand the global landscape in 2022:
primary_school_enrolment_rate: measures the percentage of children of official primary school age who are enrolled in primary education.
life_expectancy: is the average number of years someone is expected to live
unemployment_rate: measures the percentage of the total labor force that is without work but are able to work/ looking for work.
Primary School Enrollment EDA
Mean: 100.87404840034348
Median: 100.0222473144529
Standard Deviation: 12.037531967222588
Life Expectancy EDA
Mean: 72.4165186136072
Median: 73.5146341463415
Standard Deviation: 7.713322276991691
Unemployment Rate EDA
Mean: 7.268661290322581
Median: 5.5375
Standard Deviation: 5.827726289581319
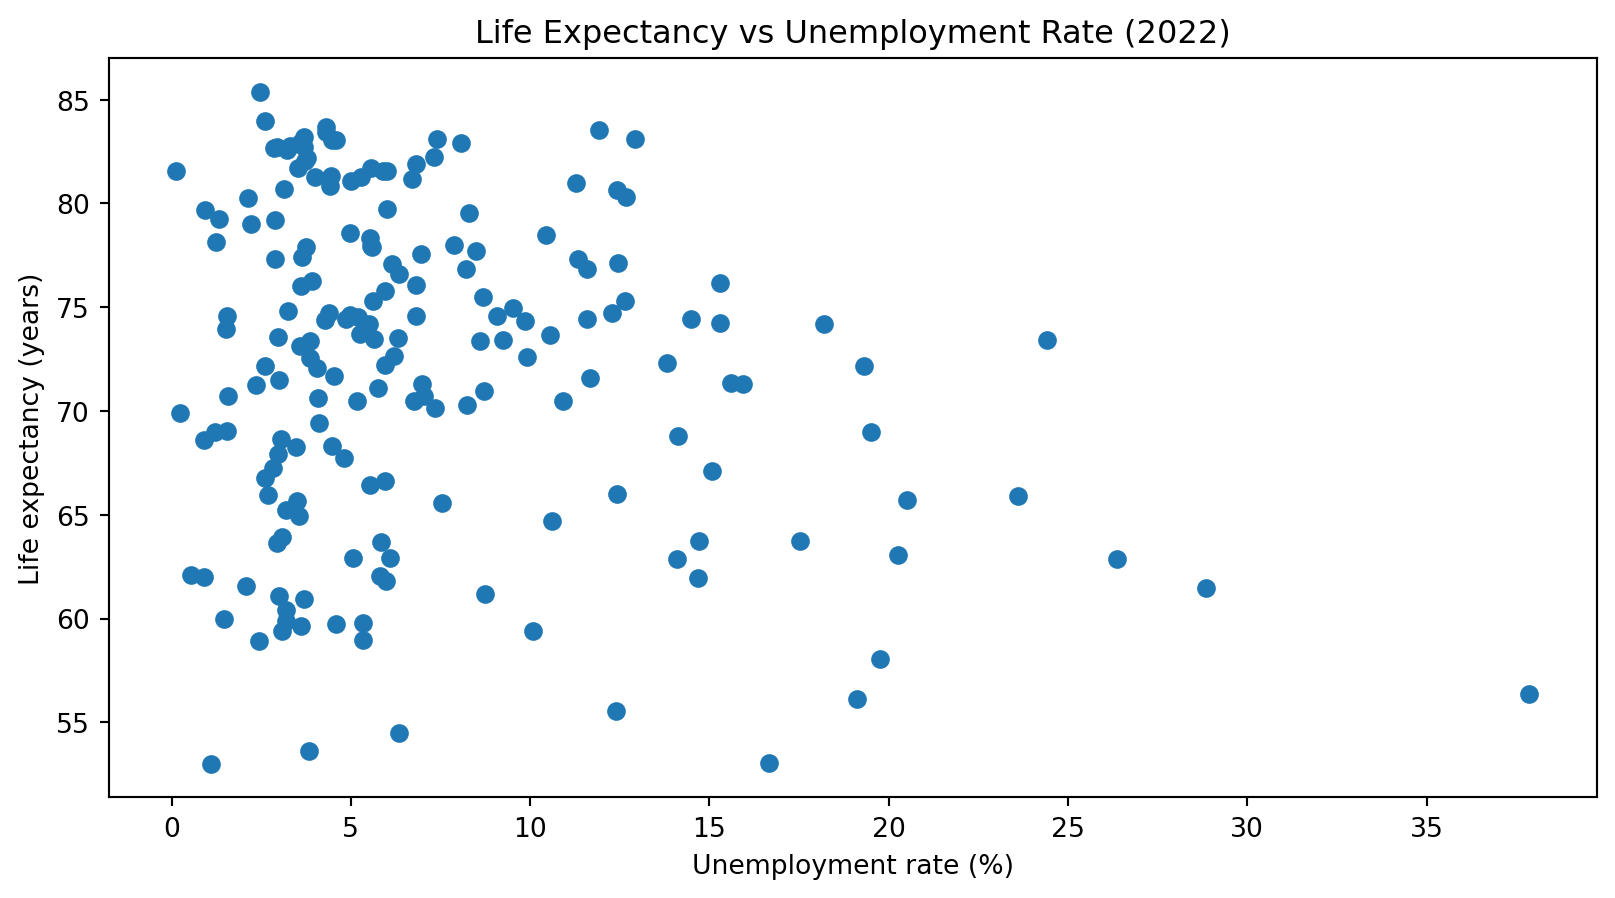
Scatterplot (life expectancy vs unemployment rate)
Figure 1: Life expectancy vs. unemployment rate in 2022. Source: World Bank (2022).
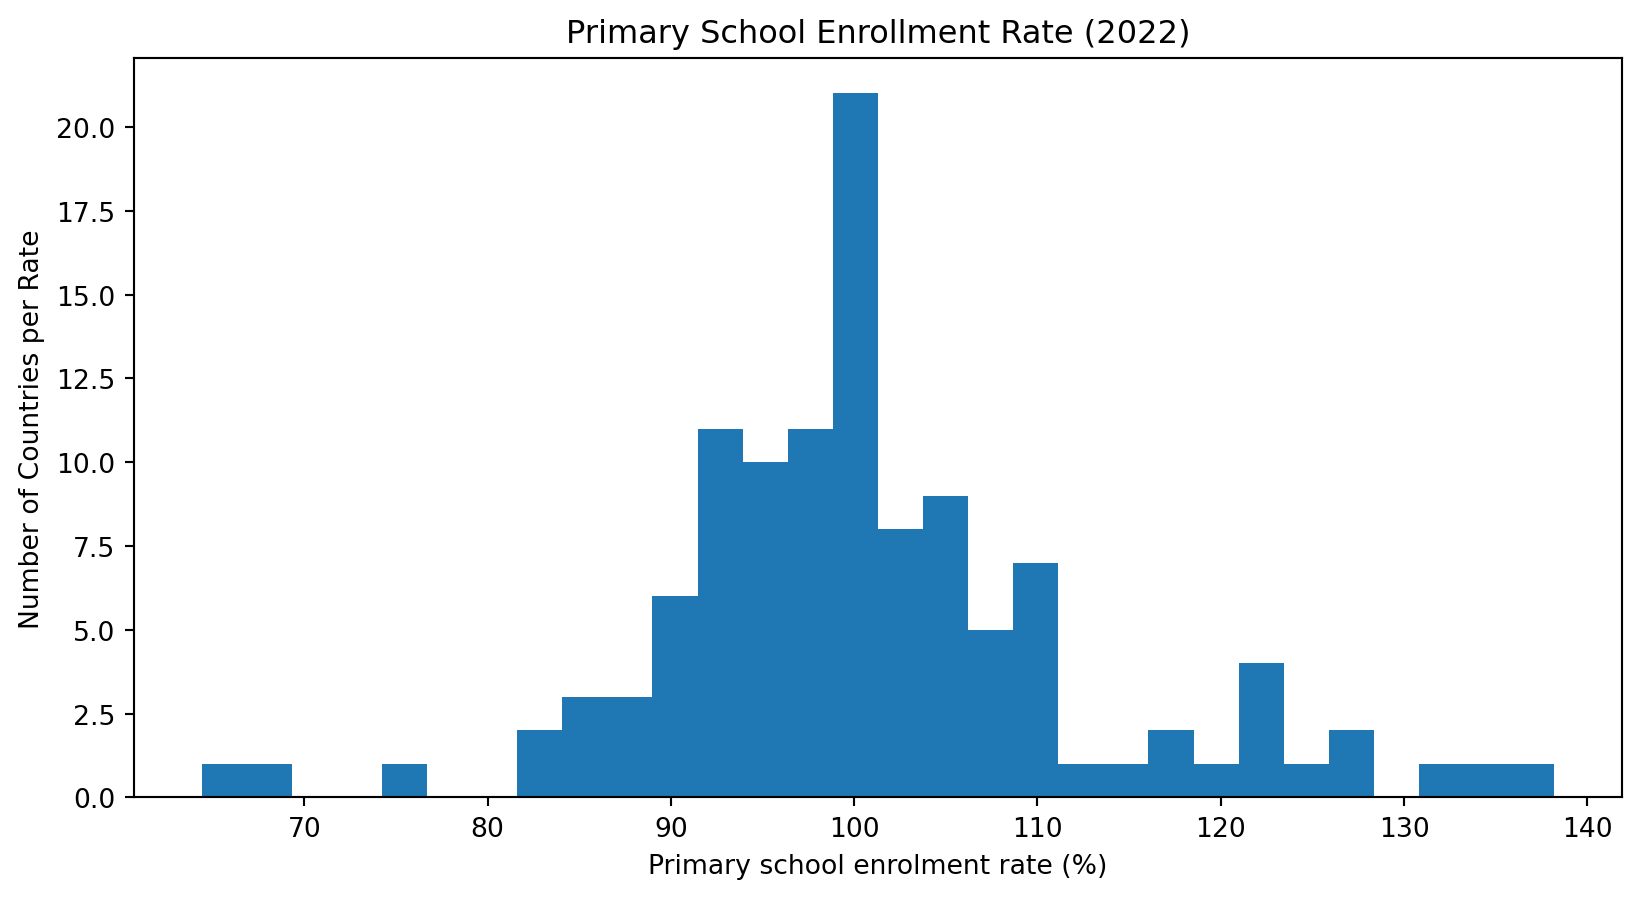
Histogram (primary school enrollment rate)
Figure 2: Primary school enrolment rate distribution (WDI 2022). Source: World Bank (2022).
Key Statistics
Table 1: Key summary statistics for selected indicators (WDI 2022). Source: World Bank (2022).
Mean
Median
Standard Deviation
Minimum
Maximum
primary_school_enrolment_rate
100.874048
100.022247
12.037532
64.395401
138.192001
life_expectancy
72.416519
73.514634
7.713322
52.997000
85.377000
unemployment_rate
7.268661
5.537500
5.827726
0.130000
37.852000
Conclusion
Negative relationship: As shown in @fig-life-unemployment, higher unemployment is generally associated with lower life expectancy.
Supported by research: Prior studies link long-term unemployment to reduced life expectancy and greater disability [@laditka_unemployment_disability_life_expectancy_2016; @assari_employment_life_expectancy_2017].
Enrollment pattern: @fig-enrolment-hist shows primary school enrollment rates are centered near 100%.
>100% explained: Rates above 100% occur because gross enrollment includes over- and under-aged students.
Indicator variation: @tbl-key-stats highlights differences in spread and central tendency across variables.